Kategorien
- Angewandte Natur- und Kulturwissenschaften
- Angewandte Sozial- und Gesundsheitswissenschaften
- Architektur
- Bauingenieurwesen
- Betriebswirtschaft
- Elektro- und Informationstechnik
- Informatik und Mathematik
- Maschinenbau
- Weitere Einrichtungen


Hochschulleitung

Servicestelle Lehre & Didaktik

Holz-Ingenieur-Bau-Werke
194 views
0 favorites
 bof39520
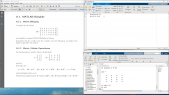
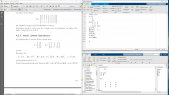
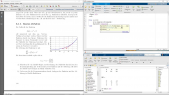
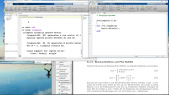
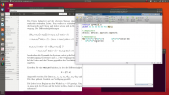
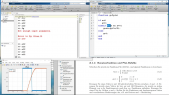
Verwendung von Matlab, Erstellen von Benutzerfunktionen und graphische Darstellung von Funktionen.
Teil 1 von 2